By Audrey Cooney, news correspondent
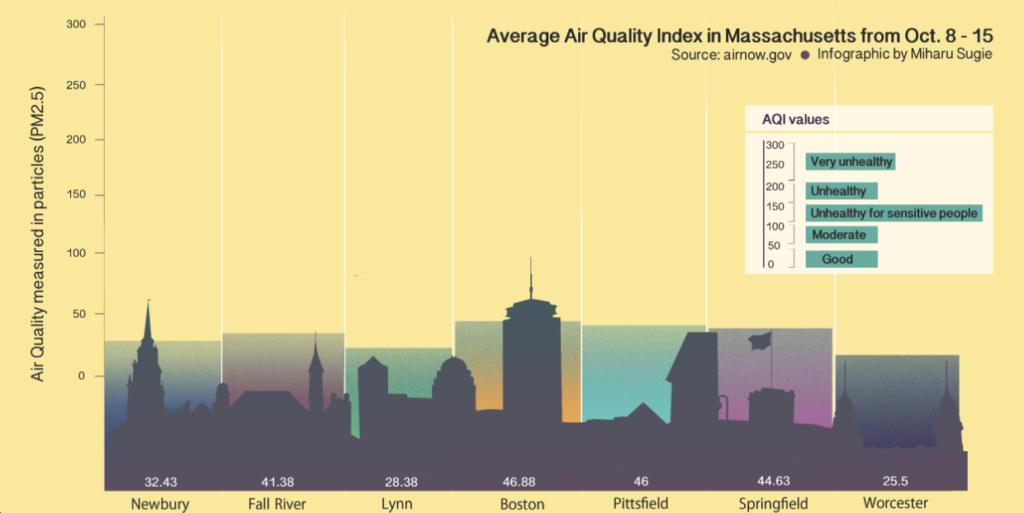
New England residents enjoyed an overall higher air quality this summer than in previous summers.
Between April and September, recorded ozone levels in New England exceeded the level deemed healthy by the Environmental Protection Agency (EPA) nine times. Connecticut recorded eight unhealthy days this summer, while New Hampshire had one and Massachusetts, Rhode Island, Maine and Vermont had none. This is a significant drop from previous summers. 2013 saw 20 unhealthy air days while 2012 recorded 29.
During the so-called “ozone season,” which runs from April 1 to Sept. 30, data are collected at roughly 60 state and private air quality monitoring stations scattered throughout New England that record the amount of ground-level ozone.
“Two factors played an important role in the improvement this summer: improved emission controls and meteorology,” Anne K. McWilliams, an environmental scientist working with the EPA, said.
The first factor that led to better air quality ratings was this summer’s lower temperatures. Light and heat play a role in the development of ground-level ozone, so lower temperatures correspond with lower amounts of smog, and thus healthier air, according to McWilliams.
Data on the EPA’s website indicate that New England’s air quality has been steadily improving over the course of the last 30 years, partly due to a recent decrease in extreme heat during the summers. In 2011, temperatures at Bradley Airport, just outside of Hartford, Conn., reached 90 degrees on only 15 days, as opposed to 34 days in 2010. The EPA recorded only 16 days of unhealthy ozone levels in 2011, compared to 29 in 2010. In fact, EPA data shows that the amount of days where temperatures exceeded 90 degrees and the number of days with unhealthy amounts of tropospheric ozone have both been on the decline since the 1980s.
McWilliams commented on the reduced carbon emissions and its effect on New England’s air quality.
“Overall, the emissions which contribute to ozone formation have been reduced,” McWilliams said. “This past summer, we didn’t see many prolonged periods in which the air pollutants were transported into the region.”
EPA officials think strict standards for vehicle emissions have begun to have the intended positive effect.
A region’s air quality is determined by the amount of ground-level ozone present in the area’s atmosphere. Breathing ozone irritates the respiratory system, damages the lining of the lungs and weakens an individual’s immune system. To assess the level of this danger, scientists measure the amount of ozone present in the air, grading the air for safety and quality on a scale of good to hazardous.
The improvement of New England’s air quality is an encouraging sign for proponents of environmental protection measures.
Kat O’Brien, a sophomore environmental science major and secretary of TERRA Society, a student organization associated with Northeastern’s Earth and Environmental Science Department, appreciates the positive nature of this summer’s air quality data, yet balances it with a global perspective.
“It just goes to show that the environmental policies that are being enacted are actually working, and really validates all the work being done by environmentalists,” O’Brien said. “That being said, there is still more work to be done.”
While the findings in New England indicate that current efforts to curb carbon emissions have been successful, they cannot be used to indicate the level of progress made on a global scale. A report issued in 2013 by the Netherlands Environmental Assessment Agency indicates that emission reductions in America belie an overall increase in carbon production in the rest of the world. In China, for example, the rate of carbon emissions increases as the country expands its industrial might.
“It is imperative that we do not get too cozy in the idea that our emissions are decreasing, when globally they are not,” O’Brien said. “This is a global issue, and I always fear that reassuring data can make people too comfortable and stop looking at the issue as a whole.”
Infographic by Miharu Sugie


